
MarketRadar read: neutral
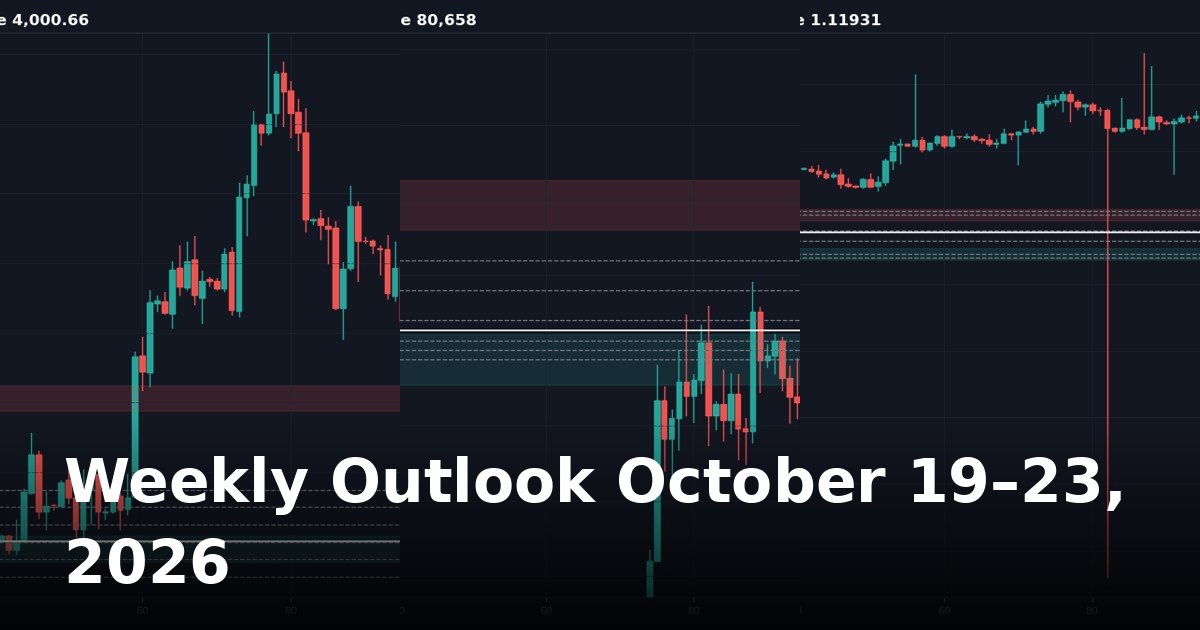
Markets are closed for the weekend — time to review the week that was (October 19–23, 2026) and map the levels that matter for the week ahead. This outlook covers gold (XAUUSD), Bitcoin (BTCUSD) and EUR/USD: weekly price action, daily-chart levels with marked charts, and the fundamental themes carrying into next week.
Gold (XAUUSD) — week in review
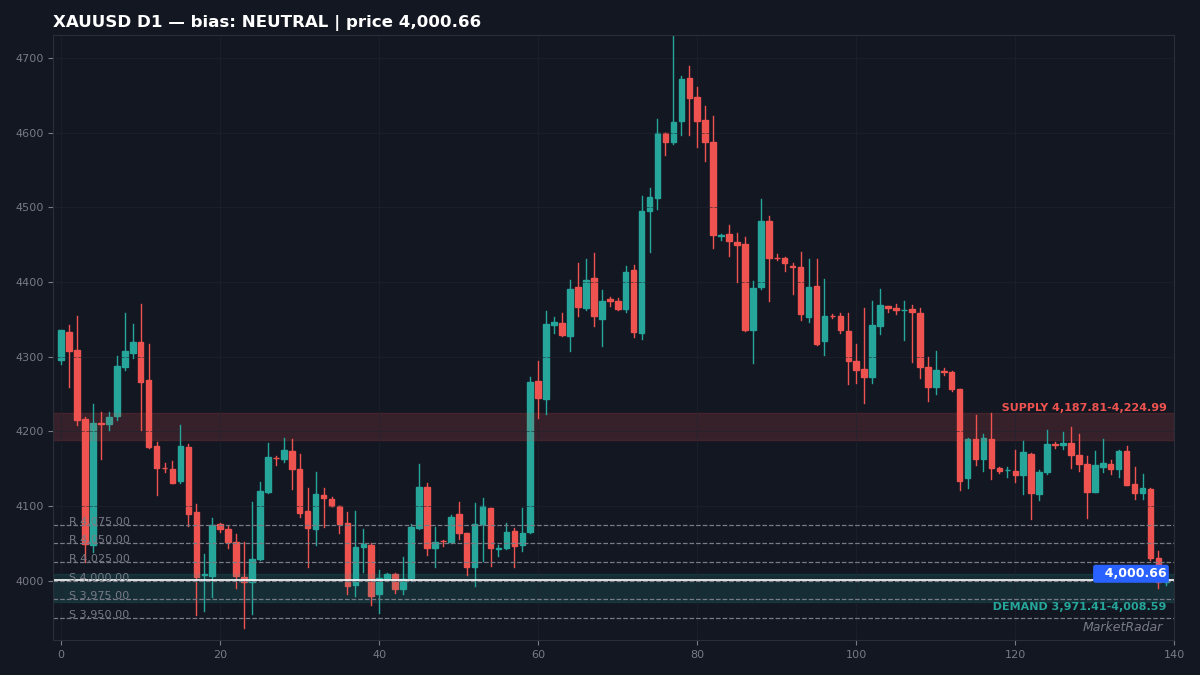
Week range 3,990.00–4,152.26, close 4,000.66 (-3.12% on the week). Daily bias: neutral. Resistance above: 4,025.00, 4,050.00, 4,075.00. Support below: 4,000.00, 3,975.00, 3,950.00. Supply zone 4,187.81–4,224.99; demand zone 3,971.41–4,008.59.
The last daily candle closed at 3,998.18, higher by +0.06%, after trading between 3,990.00 and 4,039.79.
That is closing inside the previous session's range — no clear winner into the close. The close sits below the 50-period average at 4,229.89.
D1 — XAUUSD daily
Price 4,000.66 — no clear directional edge on the daily chart (50-period average 4,229.89, ATR 46.47). Resistance: 4,025.00, 4,050.00, 4,075.00. Support: 4,000.00, 3,975.00, 3,950.00. Supply zone 4,187.81–4,224.99; demand zone 3,971.41–4,008.59. Daily closes carry the most weight — when D1 and H4 agree, the move usually has legs.
H4 — XAUUSD 4-hour
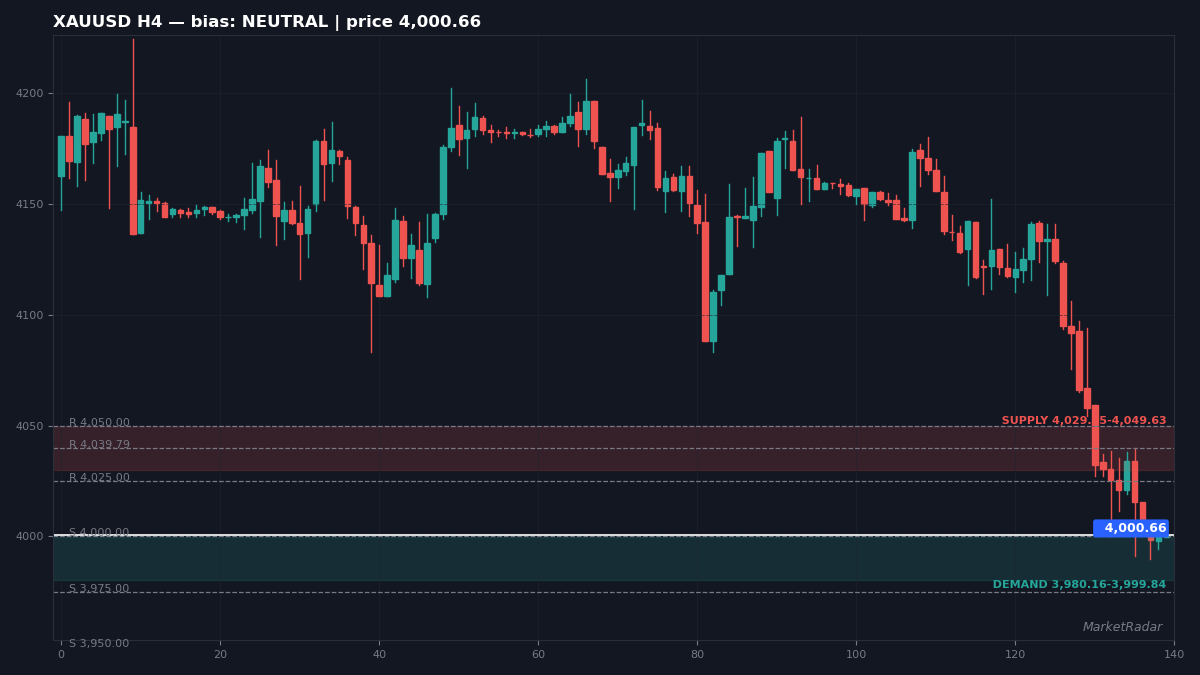
At 4,000.66, no clear directional edge on the 4-hour timeframe (50-period average 4,115.20, ATR 24.61). Overhead hurdles: 4,025.00, 4,039.79, 4,050.00. Downside cushions: 4,000.00, 3,975.00, 3,950.00. Overhead supply sits at 4,029.95–4,049.63, with demand at 3,980.16–3,999.84. The swing trader's execution timeframe.
On the hourly chart, price 4,000.66 trades below the 50-period average at 4,034.16; 4,025.00 caps the upside and 4,000.00 floors it — the intraday map for Monday's open.
Key levels — XAUUSD
| Level | Type | Spotted on |
|---|---|---|
| 4,075.00 | Resistance | D1 |
| 4,050.00 | Resistance | D1 |
| 4,039.79 | Resistance | H4 |
| 4,035.17 | Resistance | H1 |
| 4,025.00 | Resistance | D1 |
| 4,008.07 | Resistance | M15 |
| 4,006.07 | Resistance | M15 |
| 4,000.00 | Support | D1 |
Bitcoin (BTCUSD) — week in review
80,658 is where the week ended — -1.45% over five sessions that spanned 80,418–84,840. The daily chart reads neutral heading into next week.
Overhead supply sits at 81,000, 82,000, 83,000; underneath, 80,329, 80,000, 79,709. The week's supply shelf spans 84,012–85,668, its demand shelf 78,881–80,537.
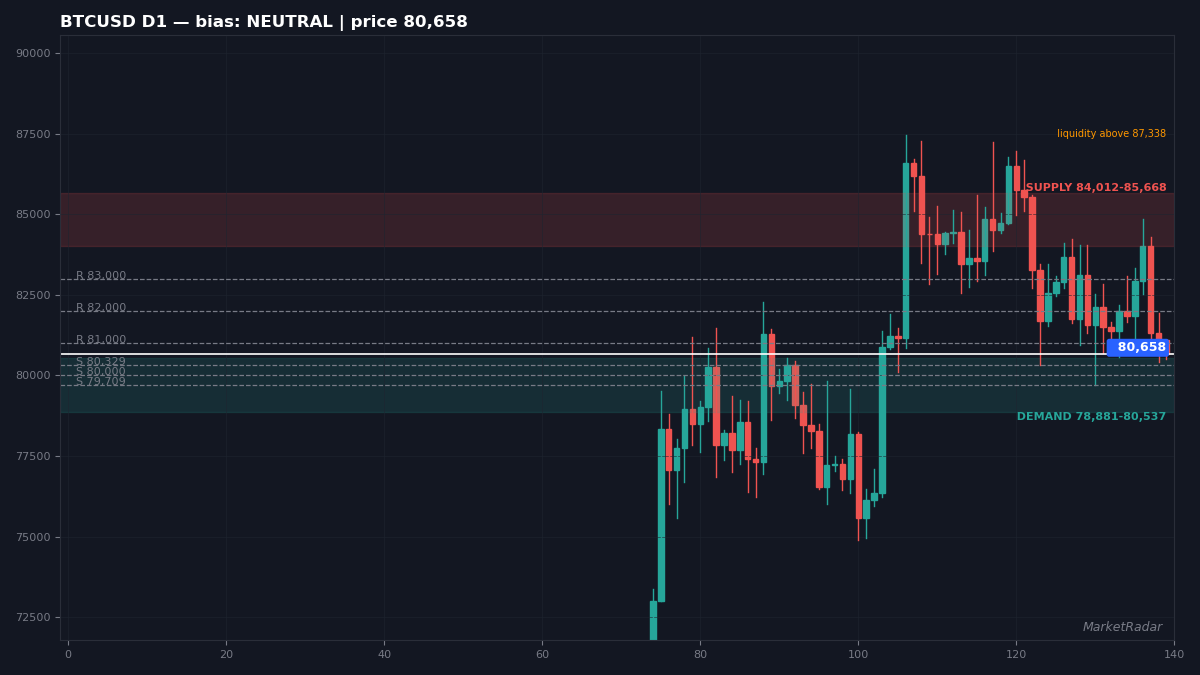
The last daily candle closed at 81,086, lower by -0.53%, after trading between 80,418 and 81,943.
That is closing inside the previous session's range — no clear winner into the close. The close sits below the 50-period average at 81,797.
D1 — BTCUSD daily
Price 80,658 — no clear directional edge on the daily chart (50-period average 81,797, ATR 2,071). Resistance: 81,000, 82,000, 83,000. Support: 80,329, 80,000, 79,709. Buy-side liquidity sits above 87,338. The supply shelf: 84,012–85,668; the demand shelf: 78,881–80,537. Daily closes carry the most weight — when D1 and H4 agree, the move usually has legs.
H4 — BTCUSD 4-hour
At 80,658, structure favors sellers on the 4-hour timeframe (50-period average 81,953, ATR 740). Overhead hurdles: 81,000, 81,943, 82,000. Downside cushions: 80,000, 79,000, 78,000. Sellers' liquidity pools below 80,612. Supply overhead at 81,647–82,239; demand underneath at 80,272–80,864. The swing trader's execution timeframe.
Hourly structure in one line: 80,658 against a 81,491 average, first resistance 81,000, first support 80,418.
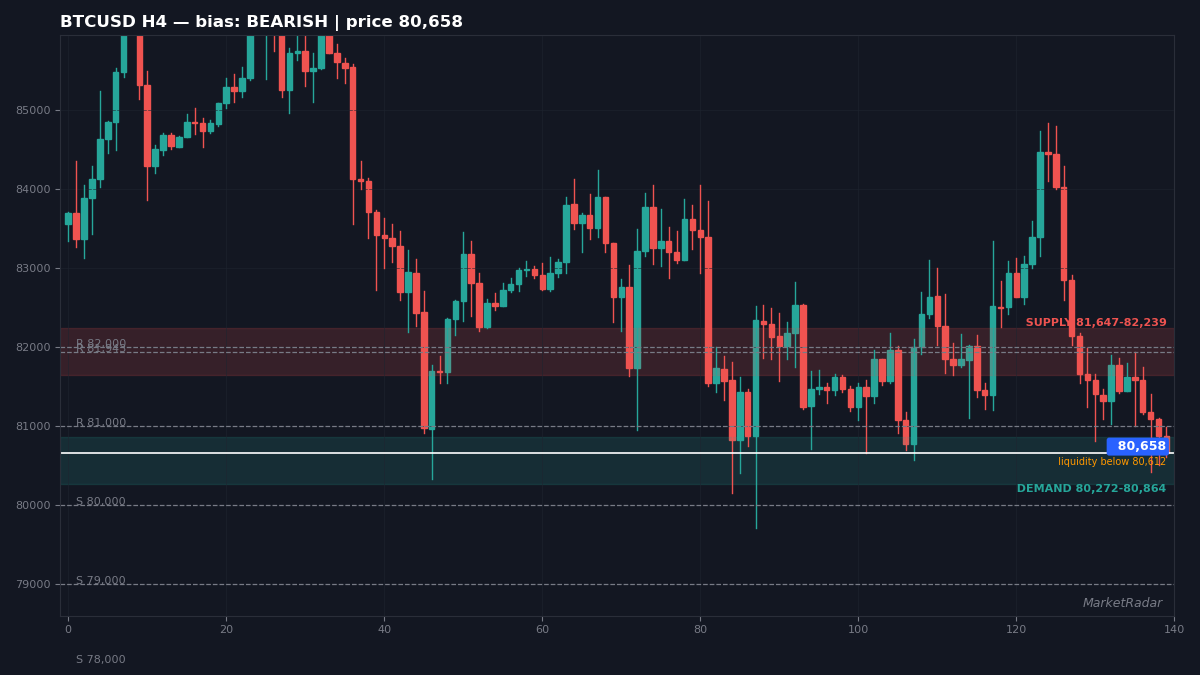
Key levels — BTCUSD
| Level | Type | Spotted on |
|---|---|---|
| 83,000 | Resistance | D1 |
| 82,000 | Resistance | D1 |
| 81,943 | Resistance | H4 |
| 81,902 | Resistance | H1 |
| 81,000 | Resistance | D1 |
| 80,993 | Resistance | M15 |
| 80,992 | Resistance | M15 |
| 80,508 | Support | M15 |
Euro / US Dollar (EURUSD) — week in review
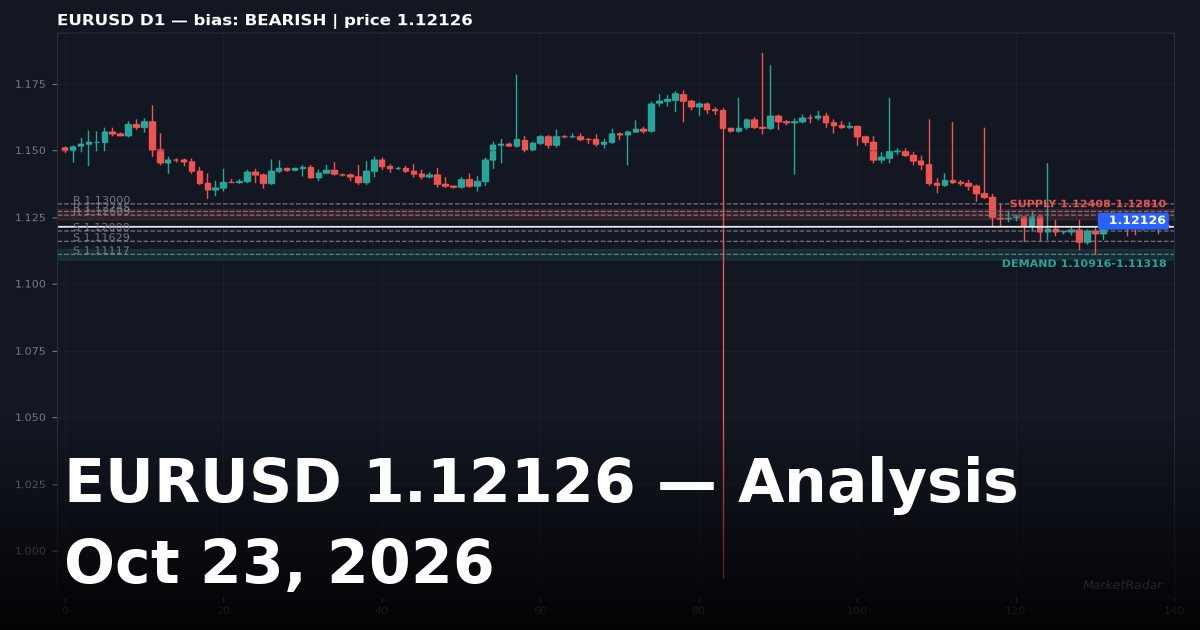
Daily bias: bearish. Zones first: supply 1.12402–1.12816, demand 1.10910–1.11324.
That framing comes from a 1.11865–1.12609 week-range and a 1.11931 close, -0.17% on the week. Resistance above: 1.12000, 1.12609, 1.12745. Support below: 1.11629, 1.11117, 1.11000.
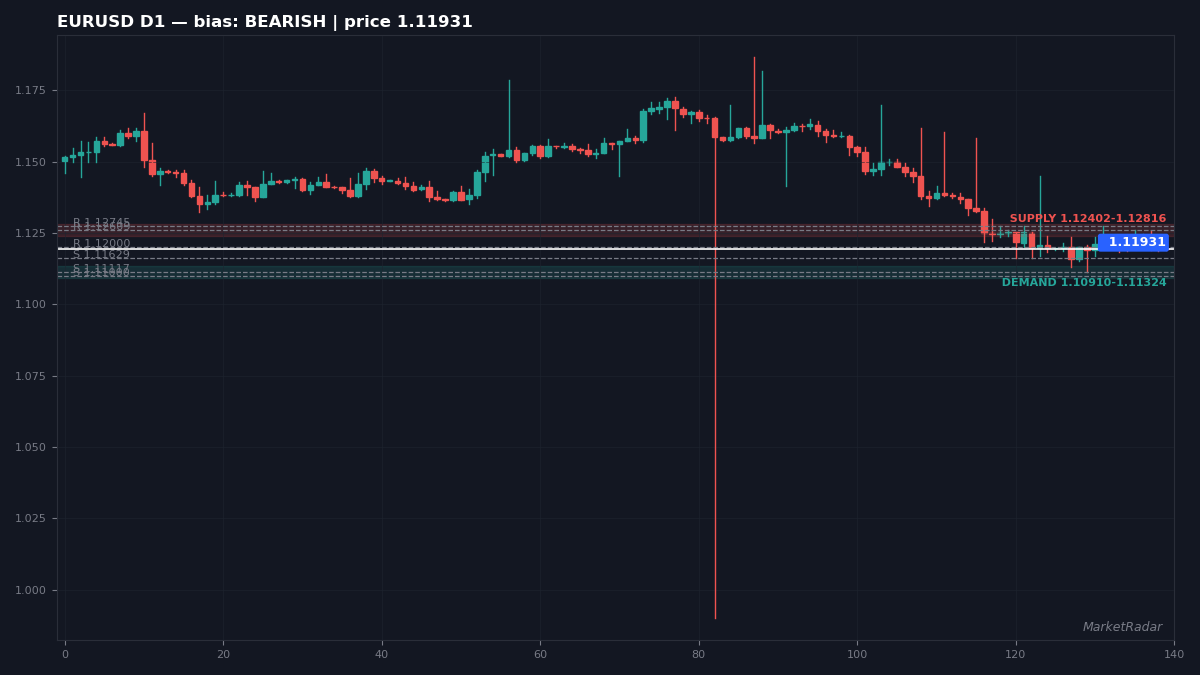
The last daily candle closed at 1.11939, lower by -0.01%, after trading between 1.11865 and 1.12256.
That is closing inside the previous session's range — no clear winner into the close. The close sits below the 50-period average at 1.13606.
D1 — EURUSD daily
Price 1.11931 — structure favors sellers on the daily chart (50-period average 1.13606, ATR 0.00517). Resistance: 1.12000, 1.12609, 1.12745. Support: 1.11629, 1.11117, 1.11000. Sellers defend supply at 1.12402–1.12816; buyers defend demand at 1.10910–1.11324. Daily closes carry the most weight — when D1 and H4 agree, the move usually has legs.
H4 — EURUSD 4-hour
At 1.11929, no clear directional edge on the 4-hour timeframe (50-period average 1.12220, ATR 0.00184). Overhead hurdles: 1.12000, 1.12449, 1.12557. Downside cushions: 1.11891, 1.11865, 1.11000. Sellers' liquidity pools below 1.11878. The 4-hour supply zone is 1.12483–1.12631; demand is 1.11791–1.11939. The swing trader's execution timeframe.
The 1-hour view into the weekend: 1.11929, below its 1.12078 average — 1.11903 is the first line to defend, 1.12000 the first to crack.
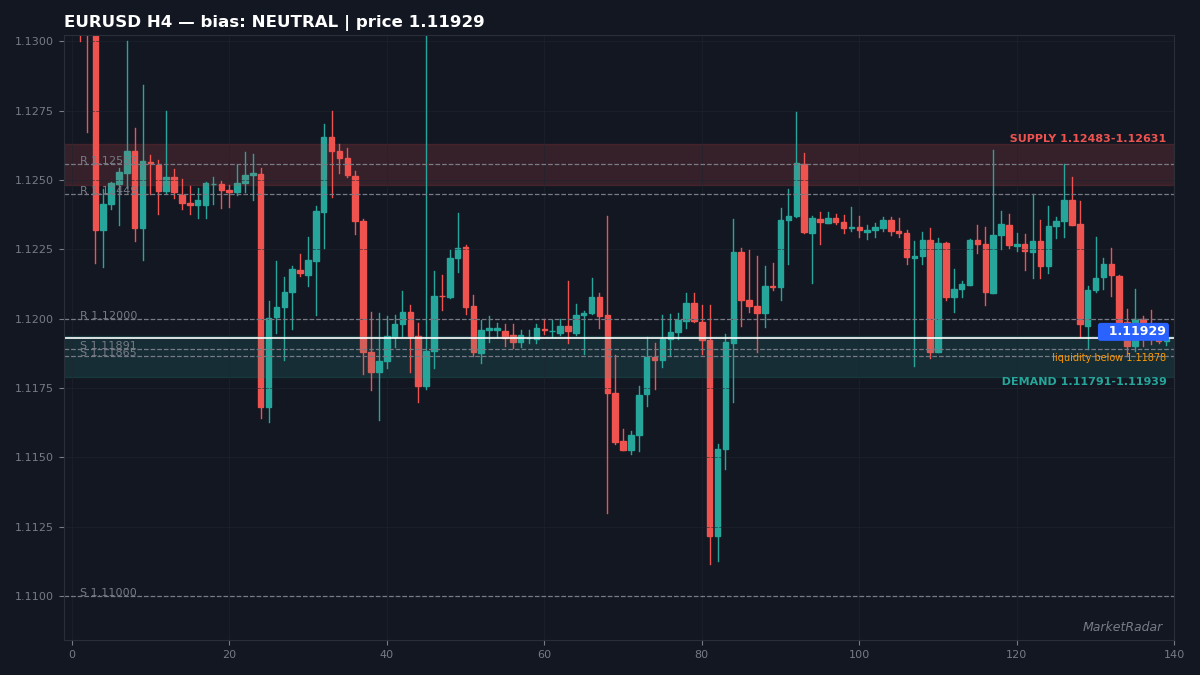
Key levels — EURUSD
| Level | Type | Spotted on |
|---|---|---|
| 1.12745 | Resistance | D1 |
| 1.12449 | Resistance | H4 |
| 1.11117 | Support | D1 |
Fundamentals — last week's impact
- Wall Street Week Ahead: Earnings flood, Fed meeting will test rickety AI market rally — ET Markets
- Global X Equal Weight Can Insurance Idx ETF declares CAD 0.06 dividend — Seeking Alpha
- Bolloré Q3 Revenue Jumps 49% On Higher Energy Prices — Nasdaq
The week's fundamental story was inflation, twice over. September CPI printed hot at 3.7% year on year (core 2.6%), with gasoline up 9.1% in a single month — over half the monthly rise; September PPI followed at 6.3% year on year, the fastest annual pace since December 2022; against that, September payrolls added just 29K jobs against 90K expected — a dovish miss arguing the other way. The Fed's stance stays hawkish / tightening cycle after its 25bp HIKE on 2026-09-16, so every inflation surprise now feeds straight into hike pricing rather than cut hopes — that repricing is the thread running through all three markets above.
Standing macro backdrop: the Fed's stance is hawkish / tightening cycle; after a 25bp HIKE on 2026-09-16; September NFP printed 29,000 vs 90,000 consensus — a big dovish miss. (MarketRadar macro desk, updated 2026-10-23.)
Week ahead — what to expect
The next Fed meeting lands October 27-28, with a December 8-9 meeting behind it. After the hot CPI and PPI pair, Friday's market pricing put an October hike near 17% and a December hike near 89% (MarketRadar macro desk) — the inflation prints, not the soft payrolls, are driving expectations into the meeting. Until the Fed speaks, the levels above do the talking: a daily close through resistance or under support is the market voting early.
- XAUUSD: first hurdle 4,025.00, first floor 4,000.00 — the daily close decides.
- BTCUSD: first hurdle 81,000, first floor 80,329 — the daily close decides.
- EURUSD: first hurdle 1.12000, first floor 1.11629 — the daily close decides.
The honest frame for next week: trends persist until a daily close proves otherwise. Watch whether gold holds above its demand zone, whether Bitcoin reclaims its nearest resistance, and whether EUR/USD keeps its higher-low structure. Those three answers set the tone.
A final note
This content is for educational purposes only and is not financial advice. Trading involves risk. Always do your own research before making any decision.