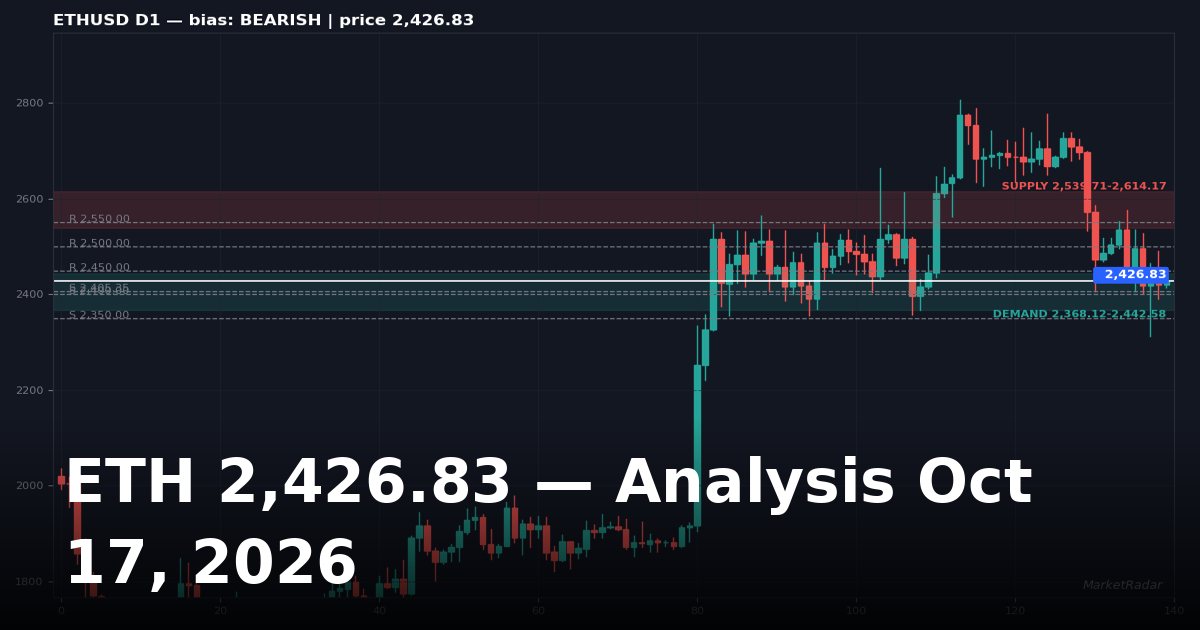

MarketRadar read: neutral
Ethereum (ETHUSD) changes hands at 2,426.83, climbed +0.27% in the last 24 hours, with a day range of 2,390.35–2,477.22. Crypto trades around the clock, so these levels update with every session. Charts below mark the daily, 4-hour, 1-hour and 15-minute picture.
Market snapshot
| Metric | Value |
|---|---|
| Price | 2,426.83 |
| 24h change | +0.27% |
| Day range | 2,390.35 – 2,477.22 |
| Previous day high / low | 2,490.84 / 2,390.35 |
| Previous week high / low | 2,576.94 / 2,313.42 |
Previous session — where the day closed
The last daily candle closed at 2,420.22, higher by +0.27%, after trading between 2,390.35 and 2,490.84.
That is closing inside the previous session's range — no clear winner into the close. The close sits below the 50-period average at 2,551.99.
Fundamental backdrop
- No fresh market-moving headlines in the last scan window; price action is leading.
Standing macro backdrop: the Fed's stance is hawkish / tightening cycle; after a 25bp HIKE on 2026-09-16; September NFP printed 29,000 vs 90,000 consensus — a big dovish miss. (MarketRadar macro desk, updated 2026-10-17.)
D1 — ETHUSD daily
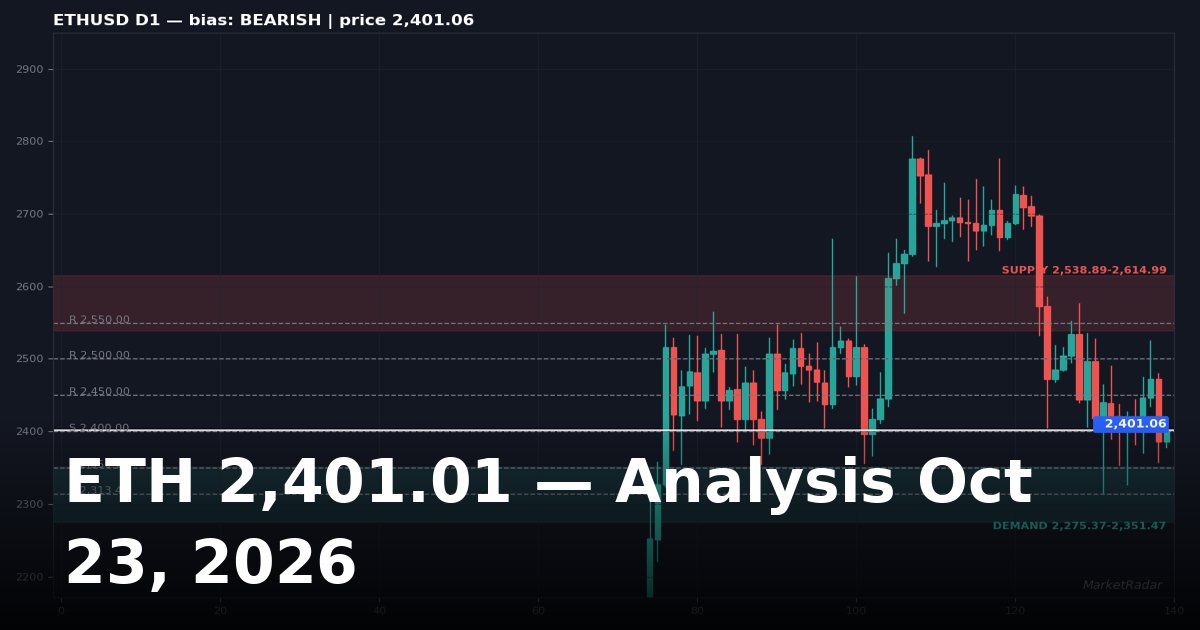
Price 2,426.83 — structure favors sellers on the daily chart (50-period average 2,551.99, ATR 93.06). Resistance: 2,450.00, 2,500.00, 2,550.00. Support: 2,405.35, 2,400.00, 2,350.00. Supply zone 2,539.71–2,614.17; demand zone 2,368.12–2,442.58. Daily closes carry the most weight — when D1 and H4 agree, the move usually has legs.
H4 — ETHUSD 4-hour
At 2,426.83, no clear directional edge on the 4-hour timeframe (50-period average 2,475.83, ATR 33.92). Overhead hurdles: 2,450.00, 2,490.84, 2,500.00. Downside cushions: 2,400.00, 2,390.35, 2,350.00. Overhead supply sits at 2,477.27–2,504.41, with demand at 2,376.78–2,403.92. The swing trader's execution timeframe.
H1 — ETHUSD 1-hour
The hourly picture at 2,426.83 shows no clear directional edge (50-period average 2,429.77, ATR 6.96). Sellers are stacked at 2,450.00, 2,464.54, 2,490.84; buyers at 2,400.00, 2,390.35, 2,350.00. 2,488.06–2,493.62 marks the supply zone; 2,387.57–2,393.13 the demand zone.
M15 — ETHUSD 15-minute
2,426.83 on the 15-minute: no clear directional edge intraday (50-period average 2,426.64, ATR 3.55). Intraday cap 2,436.96, 2,438.00, 2,450.00, floor 2,400.00, 2,350.00, 2,300.00. Watch supply at 2,436.58–2,439.42 and demand at 2,413.77–2,416.61. Entries only here. Never take directional bias from M15.
Key levels to watch
| Level | Type | Spotted on |
|---|---|---|
| 2,550.00 | Resistance | D1 |
| 2,500.00 | Resistance | D1 |
| 2,490.84 | Resistance | H4 |
| 2,464.54 | Resistance | H1 |
| 2,450.00 | Resistance | D1 |
| 2,438.00 | Resistance | M15 |
| 2,436.96 | Resistance | M15 |
| 2,405.35 | Support | D1 |
| 2,400.00 | Support | D1 |
| 2,390.35 | Support | H4 |
| 2,350.00 | Support | D1 |
| 2,300.00 | Support | M15 |
Scenarios
Bullish — buyers hold 2,400.00: the trigger is a 4-hour close back above 2,450.00, which opens the path toward 2,490.84. Confirmation strengthens if the hourly structure flips bullish as well. This view fails on a 4-hour close below 2,400.00.
Bearish — sellers break 2,400.00: the trigger is a 4-hour close under 2,400.00, which exposes 2,390.35 next. This view fails if price reclaims 2,450.00 on a 4-hour close.
Neutral — chop between 2,400.00 and 2,450.00: both edges are the levels to watch; a 4-hour close outside picks the direction.
Levels are zones, not exact lines. Waiting for a 4-hour close beyond a level filters out most intraday noise.
Charts
A quick note on the SBT lens used below. Structure-Based Trading defines ten models, and every one of them is built on the same foundation: a proper 123 swing pattern, a break of structure (BOS), and a price-delivery array — an order block, fair-value gap or mitigation zone — where price is expected to react. Each chart reading names the SBT model forming on that timeframe when its criteria are actually visible, and says so plainly when none is.
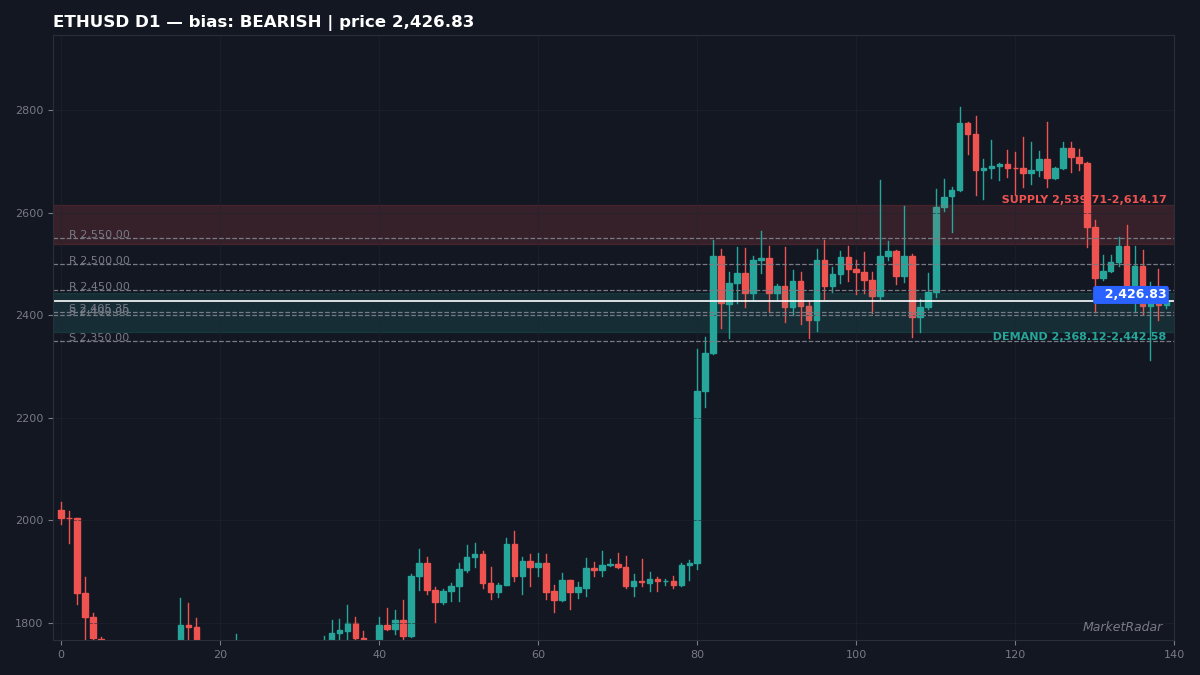
Chart reading — D1: No clean 123 on this timeframe — price is drifting bearish inside its range. Price wicked into the demand zone 2,368.12–2,442.58 and held — buyers defended the PD array, the retest SBT Models 7/8 wait for. No clean equal-high/low liquidity pools sit near price on the daily chart.
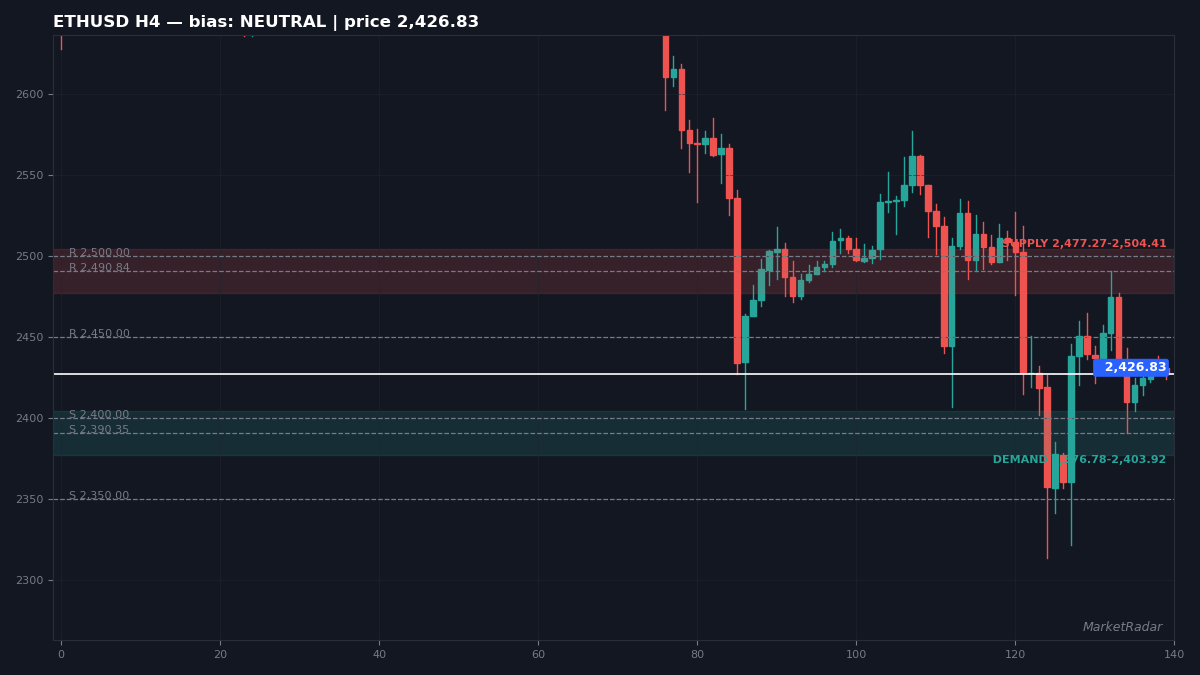
Chart reading — H4: A bullish 123 is taking shape, but structure has not broken yet — no BOS means no model trigger on this timeframe. A wick probed the demand zone 2,376.78–2,403.92 and was absorbed — buyers defended the PD array, the retest SBT Models 7/8 wait for. Liquidity pools of the equal-high/low kind are absent around price on this timeframe.
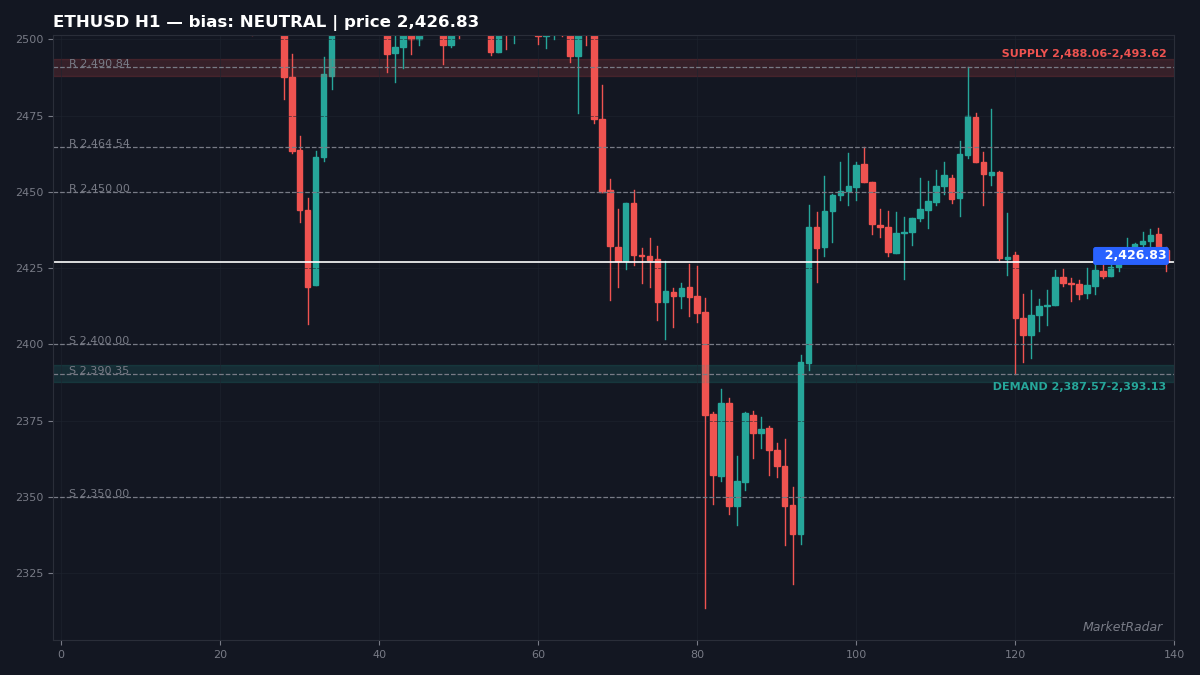
Chart reading — H1: No clean 123 on this timeframe — price is drifting neutral inside its range. Demand 2,387.57–2,393.13 below, supply 2,488.06–2,493.62 above — both PD arrays untouched; the first test decides the range scenario. No equal-high/low liquidity pools nearby on this timeframe.
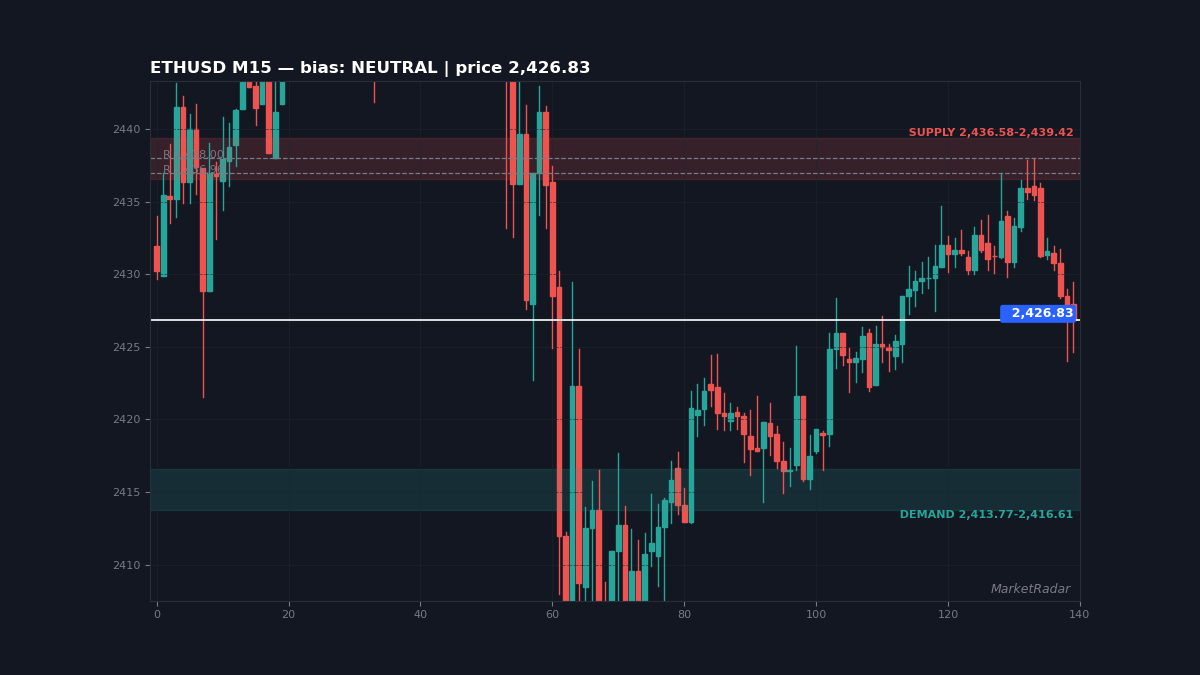
Chart reading — M15: No clean 123 on this timeframe — price is drifting neutral inside its range. Demand 2,413.77–2,416.61 below, supply 2,436.58–2,439.42 above — both PD arrays untouched; the first test decides the range scenario. No equal highs or lows stand out as liquidity magnets on the 15-minute chart.
A final note
This content is for educational purposes only and is not financial advice. Trading involves risk. Always do your own research before making any decision.