
MarketRadar read: neutral
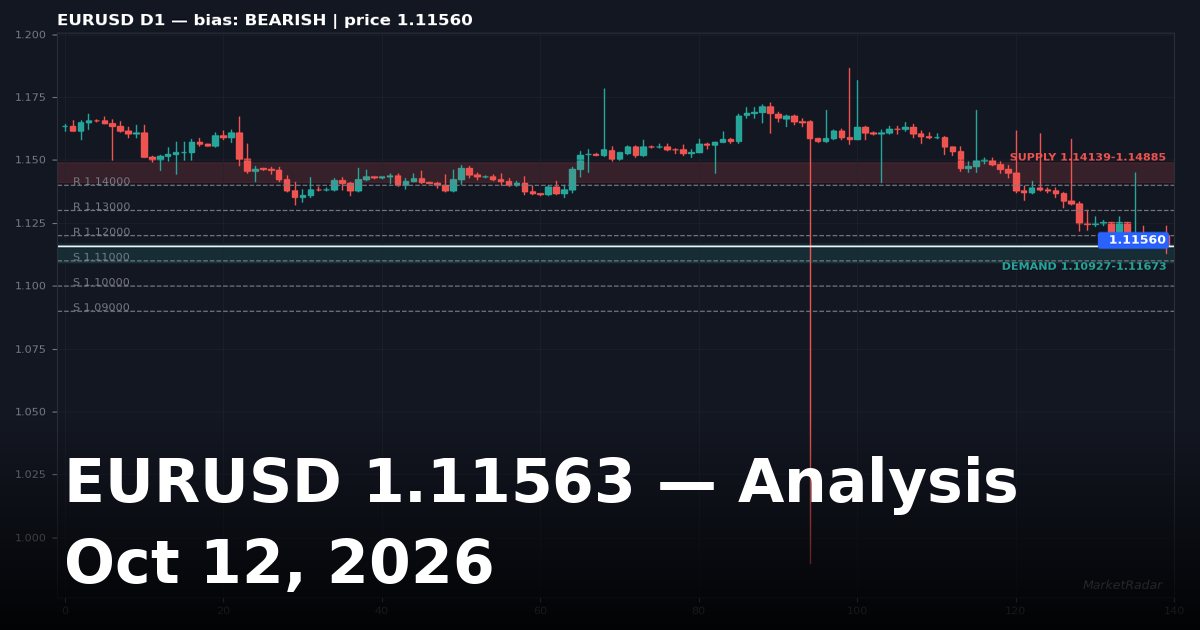
Euro / US Dollar (EURUSD) trades at 1.11563, slipped -0.41% in the last 24 hours. Day range: 1.11300–1.12371. Here are the levels that matter across timeframes, each marked on its chart, with the fundamental backdrop underneath.
Market snapshot
| Metric | Value |
|---|---|
| Price | 1.11563 |
| 24h change | -0.41% |
| Day range | 1.11300 – 1.12371 |
| Previous day high / low | 1.12137 / 1.11873 |
| Previous week high / low | 1.14512 / 1.11634 |
Previous session — where the day closed
The last daily candle closed at 1.12019, lower by -0.41%, after trading between 1.11873 and 1.12137.
That is closing inside the previous session's range — no clear winner into the close. The close sits below the 50-period average at 1.14575.
Fundamental backdrop
- Australian Dollar retreats as Fed hawkish stance, Iran tensions boost US Dollar — FXStreet
- Rupee rebounds nearly 1% after RBI moves to curb speculative trades — ET Markets
Standing macro backdrop: the Fed's stance is hawkish / tightening cycle; after a 25bp HIKE on 2026-09-16; September NFP printed 29,000 vs 90,000 consensus — a big dovish miss. (MarketRadar macro desk, updated 2026-10-08.)
D1 — EURUSD daily
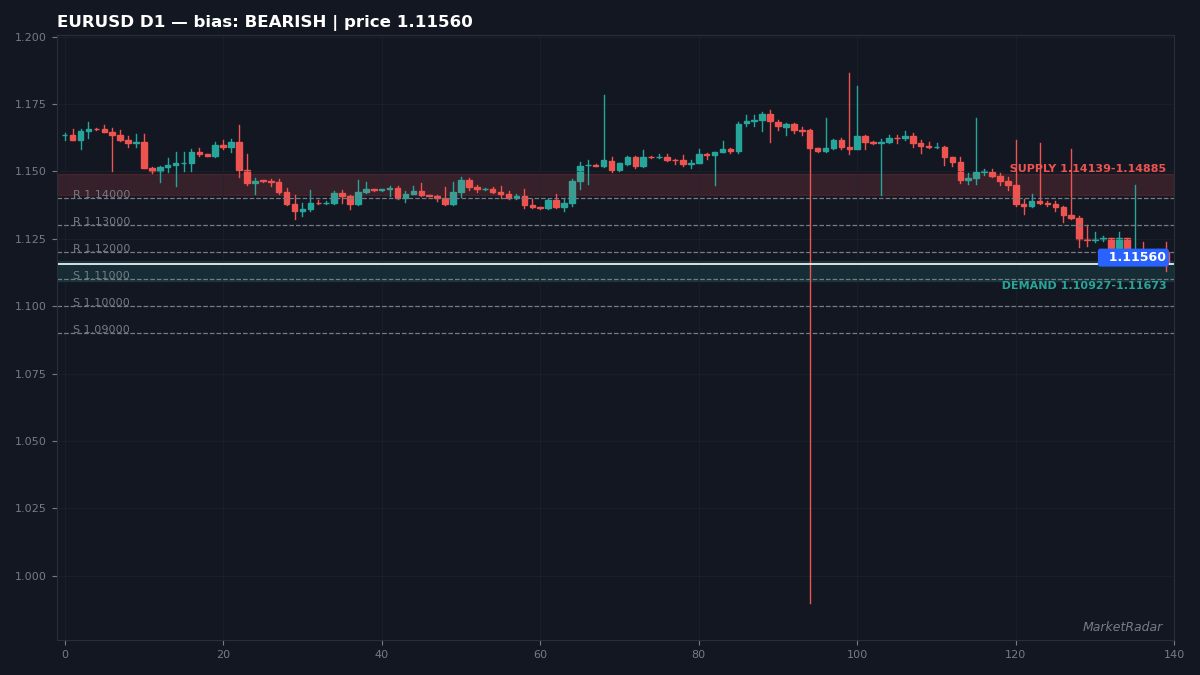
Price 1.11560 — structure favors sellers on the daily chart (50-period average 1.14575, ATR 0.00932). Resistance: 1.12000, 1.13000, 1.14000. Support: 1.11000, 1.10000, 1.09000. Supply zone 1.14139–1.14885; demand zone 1.10927–1.11673. Daily closes carry the most weight — when D1 and H4 agree, the move usually has legs.
H4 — EURUSD 4-hour
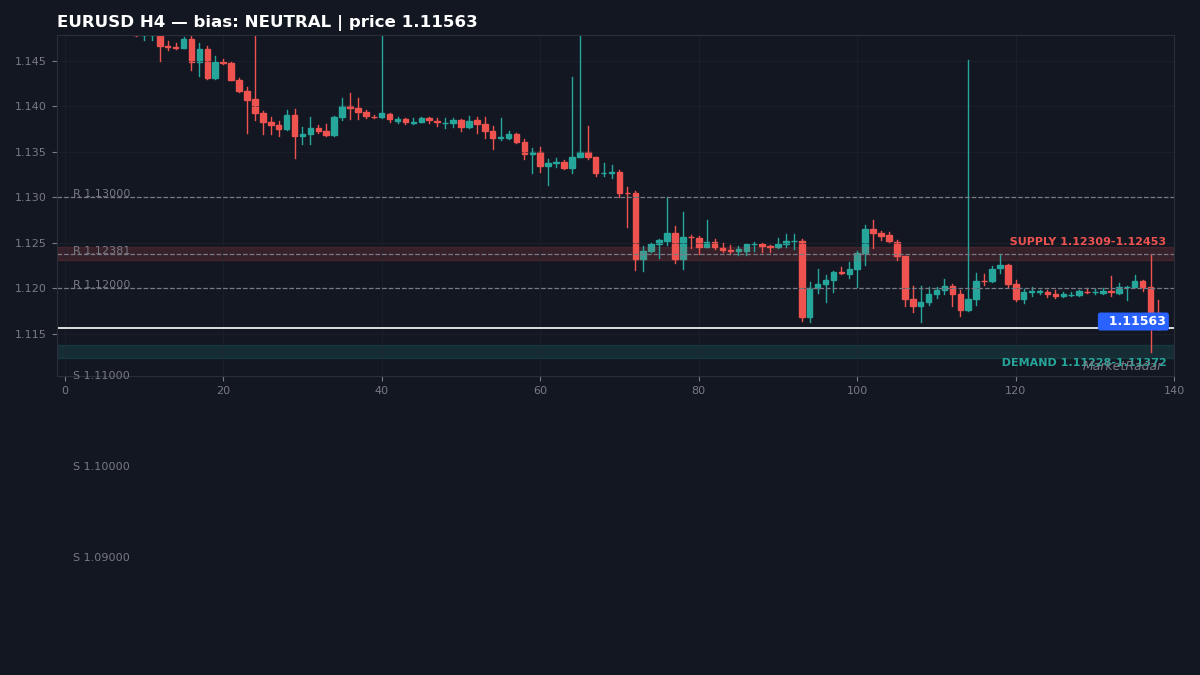
At 1.11563, no clear directional edge on the 4-hour timeframe (50-period average 1.12060, ATR 0.00179). Overhead hurdles: 1.12000, 1.12381, 1.13000. Downside cushions: 1.11000, 1.10000, 1.09000. Overhead supply sits at 1.12309–1.12453, with demand at 1.11228–1.11372. The swing trader's execution timeframe.
H1 — EURUSD 1-hour
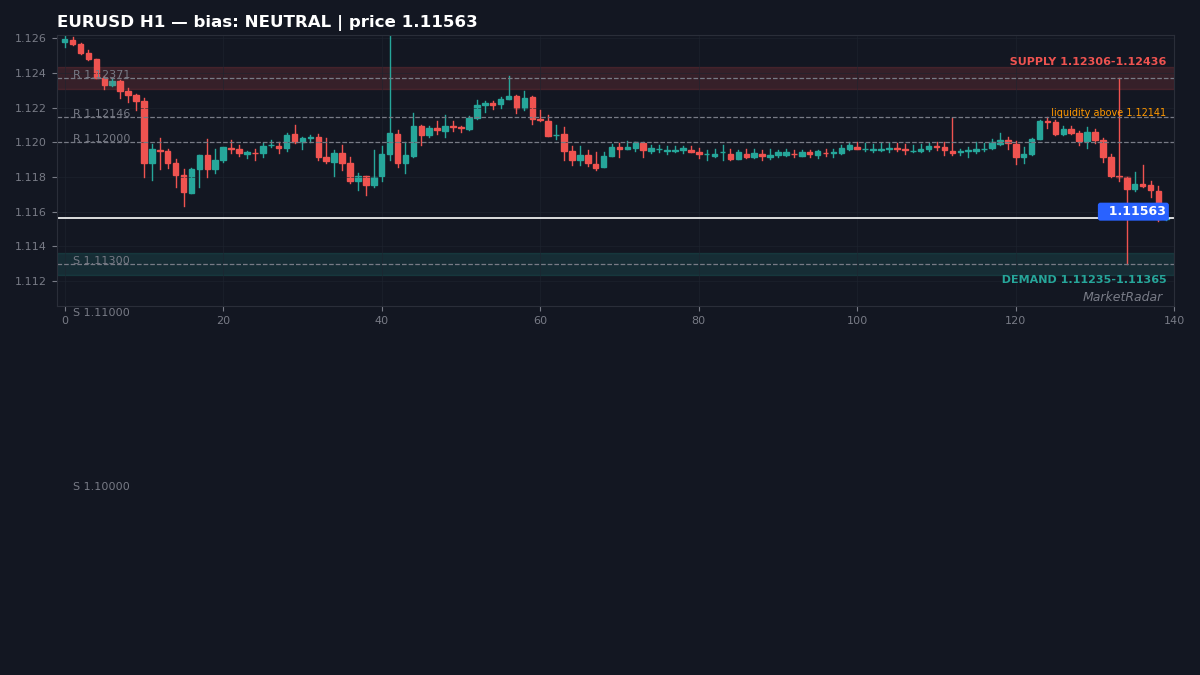
The hourly picture at 1.11563 shows no clear directional edge (50-period average 1.11935, ATR 0.00163). Sellers are stacked at 1.12000, 1.12146, 1.12371; buyers at 1.11300, 1.11000, 1.10000. Buy-side liquidity sits above 1.12141. 1.12306–1.12436 marks the supply zone; 1.11235–1.11365 the demand zone.
M15 — EURUSD 15-minute
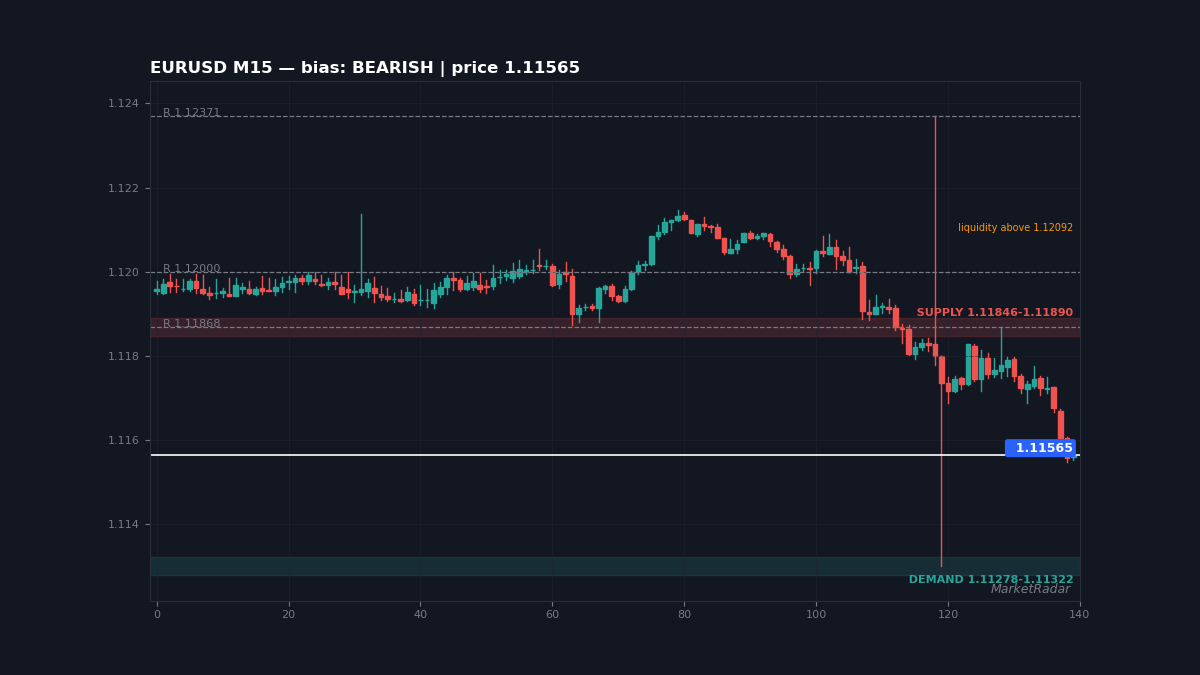
1.11565 on the 15-minute: structure favors sellers intraday (50-period average 1.11864, ATR 0.00055). Intraday cap 1.11868, 1.12000, 1.12371, floor 1.11000, 1.10000, 1.09000. Buy-side liquidity sits above 1.12092. Watch supply at 1.11846–1.11890 and demand at 1.11278–1.11322. Entries only here. Never take directional bias from M15.
Key levels to watch
| Level | Type | Spotted on |
|---|---|---|
| 1.14000 | Resistance | D1 |
| 1.13000 | Resistance | D1 |
| 1.12381 | Resistance | H4 |
| 1.11300 | Support | H1 |
| 1.10000 | Support | D1 |
| 1.09000 | Support | D1 |
Scenarios
Bullish — buyers hold 1.11000: the trigger is a 4-hour close back above 1.12000, which opens the path toward 1.12381. Confirmation strengthens if the hourly structure flips bullish as well. This view fails on a 4-hour close below 1.11000.
Bearish — sellers break 1.11000: the trigger is a 4-hour close under 1.11000, which exposes 1.10000 next. This view fails if price reclaims 1.12000 on a 4-hour close.
Neutral — chop between 1.11000 and 1.12000: both edges are the levels to watch; a 4-hour close outside picks the direction.
Levels are zones, not exact lines. Waiting for a 4-hour close beyond a level filters out most intraday noise.
Charts
A final note
This content is for educational purposes only and is not financial advice. Trading involves risk. Always do your own research before making any decision.